


Motor testing
(Image: Hottinger Brüel & Kjær (HBK))
Clean bill of health
Repeated testing of electric motors brings many benefits. Nick Flaherty examines some of the procedures in common use
Electric motor tests conducted throughout the stages of an electric motor’s life cycle provide essential information about the motor’s overall health and provide engineers with a range of benefits.
Testing improves reliability because it identifies potential issues and allows for proactive maintenance to prevent breakdowns and extend the motor’s lifespan, while also addressing electrical energy issues to reduce losses and lower operating costs.
While the specific tests conducted will vary depending on the complexity of the motor, its application and the parameters being evaluated, some of the key tests used during electric motor testing include the following:
• Electrical tests such as polarity checks and voltage level measurements
• Vibration tests to detect any imbalances or misalignments
• Thermal tests to monitor the motor’s temperature to avoid overheating
• Dynamic tests to see how the motor performs in transient states
• Noise tests to evaluate acoustic characteristics against sound standards
• Insulation tests to ensure the motor’s insulation materials won’t degrade while operating
Some examples include megger tests, high-potential (hi-pot) tests and surge testing.
A megger insulation resistance test uses a megohmmeter to apply high DC voltage to an electric motor’s windings to measure insulation health, checking for shorts to ground or between phases, ensuring safety and preventing failure by detecting degradation with high resistance readings (megaohms) versus low readings (failure).
The basic procedure involves disconnecting power, connecting probes from the megger to the motor frame (ground) and windings, applying voltage (for example 500 V for a 400 V motor) and reading the megaohm (MΩ) value.
Surge testing can find weaknesses in turn-to-turn, coil-to-coil and phase-to-phase insulation that can lead to electrical failure.
(Image: HBK)
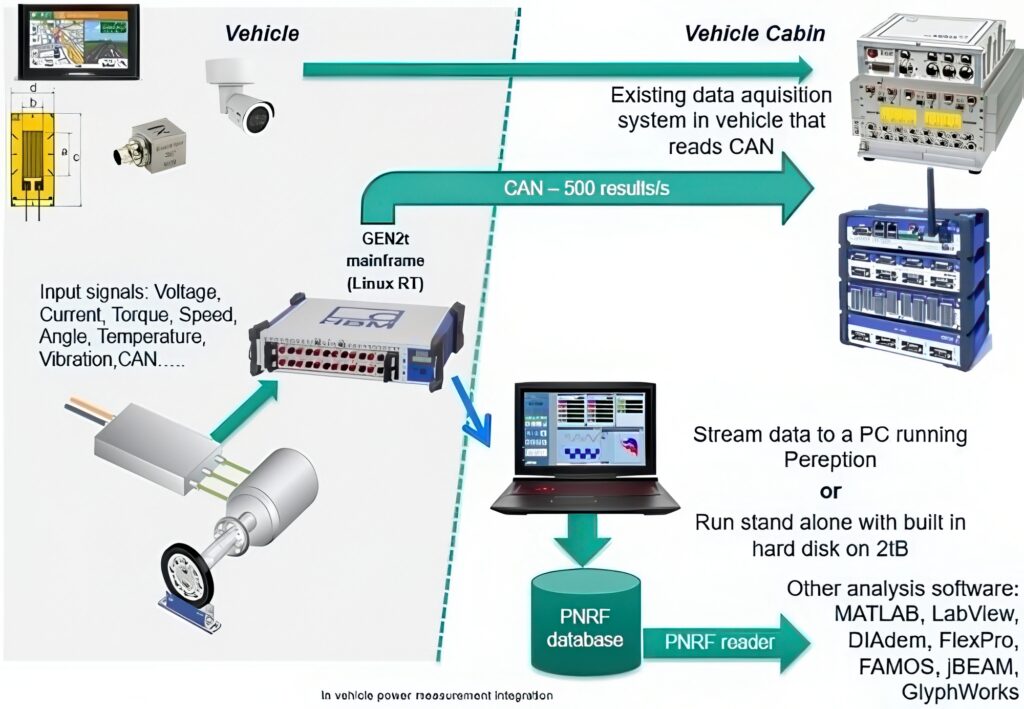
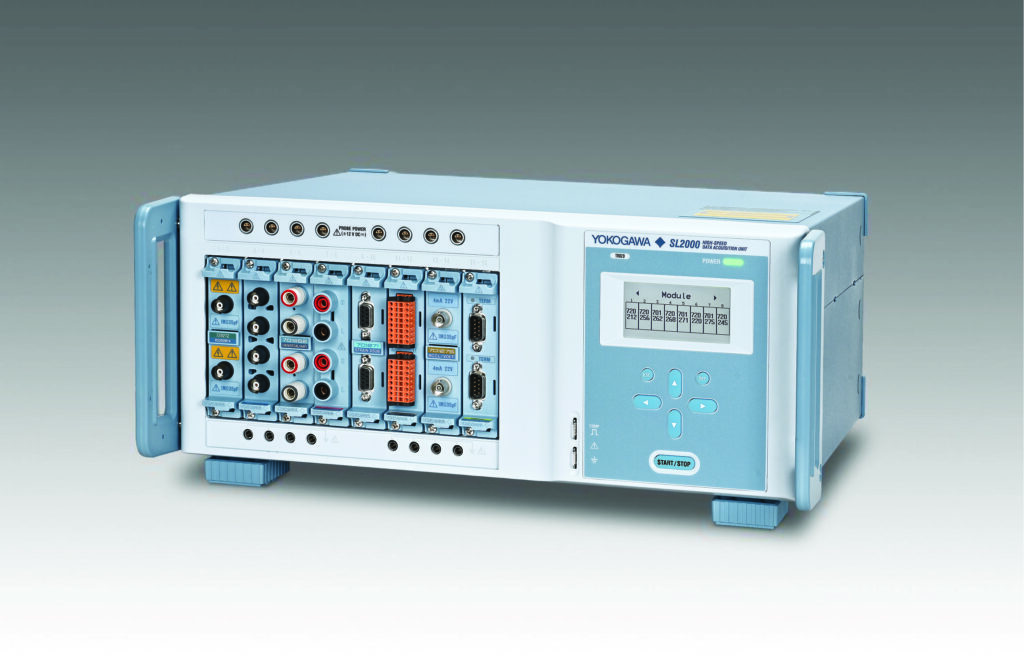
Dynamic motor power measurement
In-vehicle testing provides engineers with a method to benchmark competitors’ vehicles, calibrate drivetrains and validate the performance of the product. Electrical power measurements on motors and related power conversion circuitry are becoming necessary for evaluating vehicles, but mobile power measurements were previously difficult owing to the dynamic nature of vehicle speed. However, the latest systems for testing electric machines and drives make mobile electrical power measurements possible in real-world operating environments.
(Image: Yokogawa)
Importance of dynamic power
Electric vehicle torque and speed are dependent on voltage and current, which are constantly changing in frequency and amplitude. The measurement of these signals requires a method of tracking the frequency to properly measure power. An advanced method of frequency tracking, such as cycle detect, allows for testing beyond the simple static setpoint power and enables users to test dynamic power.
Dynamic losses are additional losses introduced during a transient condition. During the first few cycles of the machine, there is an increase in reactive power and subsequent losses. These increased losses during the transient condition would not be understood or captured by traditional efficiency maps, but will contribute to electric vehicle range and performance. By having an accurate measurement and better understanding of these losses, engineers can start to optimise drive cycles and the actual performance of the vehicles.
(Image: Ansys/Synopsys)
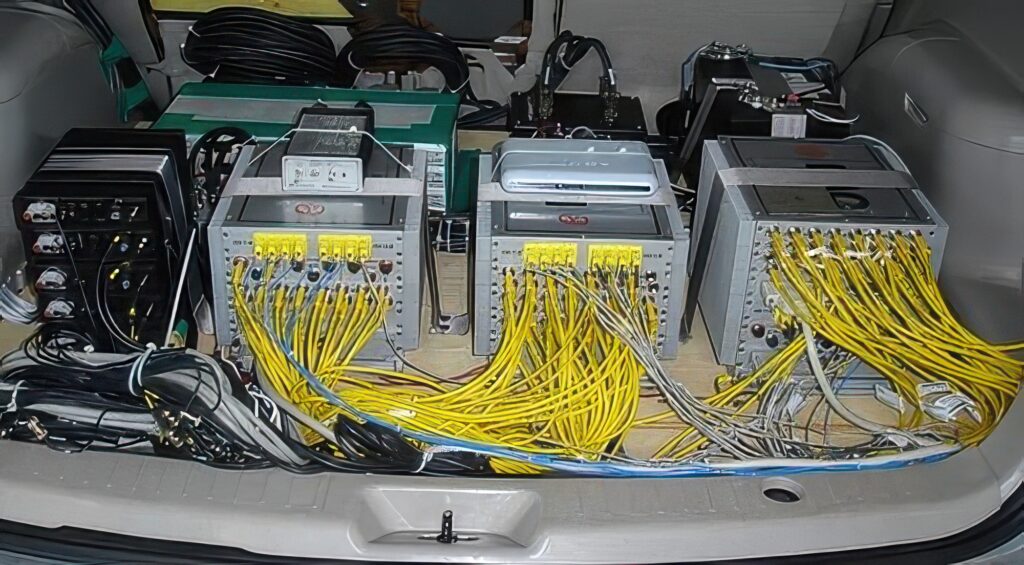
Mobile data acquisition
Mobile data acquisition is a cornerstone for vehicle evaluation, and it is used increasingly to evaluate structural durability, noise and vibration characteristics. Engineers are looking to understand the final product and how all the subsystems work together to evaluate the customer experience and ensure that the vehicle will meet durability claims. This requires instruments tailored to the application, from data acquisition systems to power analysers.
Data acquisitions can have hundreds of channels of strain, acceleration and temperature sensors as well as CAN bus, GPS and other signals to conduct a structural evaluation of a vehicle. Recording the electrical voltages and currents coming from an electric machine can provide insights into vehicle dynamics.
The introduction of electric power measurements allows correlation of powertrain values to structural dynamics and noise, vibration and harshness (NVH). Example measurements illustrate the correlation of motor power measurements to the operating conditions of the electric vehicle in which the motor is used.
Mobile power measurements offer challenges for both mechanical and electrical systems. One of the primary challenges is that the electrical frequency, which dictates speed, is constantly changing. This creates a need for a cycle detection (frequency tracker) algorithm to correctly measure electrical power.
Traditional power analysers were designed for measuring power lines at 50 and 60 Hz and they use a phase-locked loop (PLL) technology that takes time to settle onto a fixed frequency. This settling time is often in the order of seconds. Once the PLL has settled on a waveform, it determines the frequency and will use the time period for RMS and power measurements. If the frequency is constantly changing, the PLL will not settle and it will make its measurements on an arbitrary time period. This often results in impossible results such as efficiencies greater than 100%.
There is also the challenge of hybrid vehicles and hybrid transmissions that have clutches, transients, multiple machines and changing states, creating currents that are constantly changing in terms of amplitude and frequency. Transients will impact the vehicle durability (gearboxes, transmissions, etc), performance and user experience creating a demand for accurate measurements of powertrain dynamics.
Torque measurement in vehicles is also a challenge because the driveshaft is often hard to access or alter. Testing this is possible with custom sensors, telemetry systems and estimation models or using a strain gauge on the shaft.
Maximum torque per ampere (MTPA) is an optimisation strategy for the control of electric motors in EVs using field-oriented control (FOC). The goal of MTPA is to achieve the maximum possible torque output from a motor for a given current input. The maximum torque value, which corresponds to specific current magnitudes, can be decomposed into its quadrature and direct axis components. These data points are then organised into an MTPA curve or table and implemented into a drive control system to optimise motor efficiency under various operating conditions.
(Image: CTS)
Using FOC to get MTPA
FOC is a widely adopted method for controlling electric motors, especially synchronous machines such as permanent magnet synchronous motors (PMSMs). It enables precise control of the motor’s magnetic field and torque by decoupling the stator current into two orthogonal components – the direct axis (d-axis) and the quadrature axis (q-axis).
The d-axis current component (Id) controls the magnetic field, while the q-axis current component (Iq) controls the torque.
MTPA directly relates to FOC by optimising the distribution of the current components to maximise torque output for a current magnitude. MTPA ensures efficient motor operation, generates the highest possible torque without exceeding current limits and allows the motor to run at an optimal combination of Id and Iq to achieve higher torque for the same stator current.
(Image: Yokogawa)
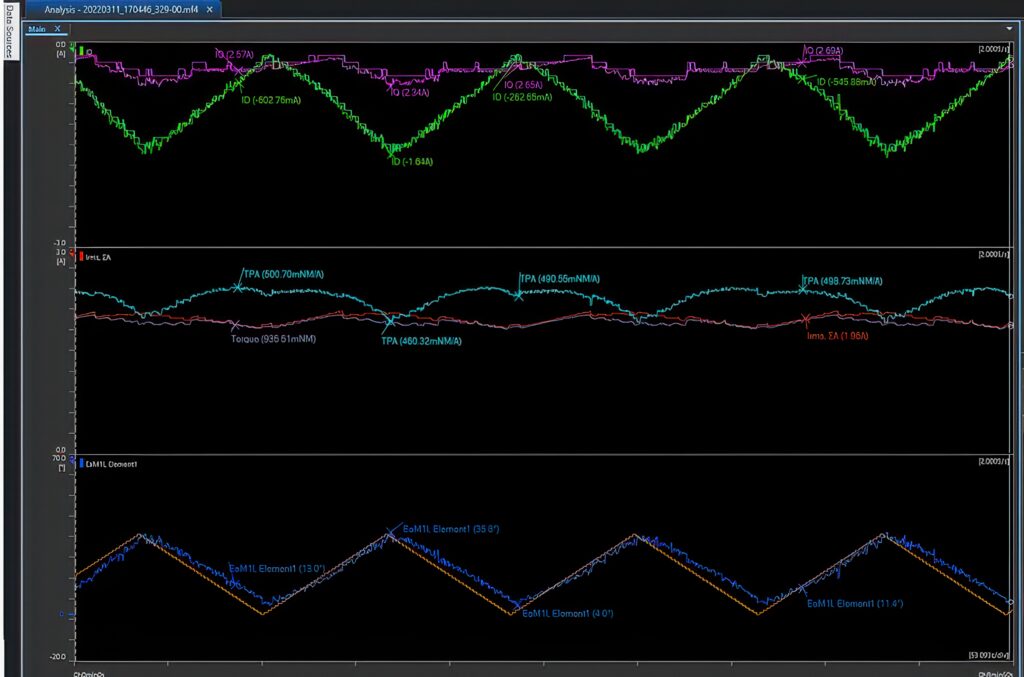
The MTPA curve
A maximum torque test determines optimal operating points, creating an MTPA curve or tabulation for integration into a motor controller. The MTPA curve shows the optimal combination of Id and Iq that maximises torque per unit current and minimises stator current losses to enhance efficiency. An MTPA graph may contrast the MTPA curve with a constant torque curve, which represents the points where the motor maintains steady torque output regardless of speed. While the constant torque curve focuses on maintaining torque, the MTPA curve aims to achieve the highest torque with the least current for better motor performance.
Curve generation
The MTPA curve is generated through a series of tests and measurements that map out optimal Id and Iq values at various torque demands. This process begins by varying Id and Iq within safe operating limits and recording the corresponding torque output. These data (i.e., current magnitude, torque, quadrature currents and direct currents) are collected across a range of operating conditions of speed and torque to ensure a comprehensive dataset that covers the full operational envelope of the motor.
The collected data enable users to determine torque per ampere (TPA) values. Next, they select the highest TPA values and identify the corresponding Id and Iq values to construct the MTPA curve for each step in total current magnitude. Finally, this MTPA curve is implemented into the motor control algorithm with continuous monitoring of each parameter ensuring optimal motor performance under all conditions.
MTPA testing and validation require a motor drive setup (typically a PWM drive and a PMSM motor) that implements an FOC scheme, plus a power analyser capable of accurate AC power measurements on high-current signals and mathematical computations on the captured data.
Traditional power measurement systems also typically lack visual feedback or recorded data, significantly limiting the traceability of the measurements. During an in-vehicle powertrain measurement, test engineers typically want to measure a certain set of powers, voltages or currents and they need visual feedback to indicate when they have achieved their given setpoint.
Without feedback, it is difficult to know if the vehicle has achieved a certain loading point and for how long it has operated at that point. Control engineers will also use this feedback to monitor the Id and Iq control variables. Visual feedback gives the engineer insight into how the vehicle responds to different disturbances or whether they have met their setpoints. The use of visual feedback is vital for competitor vehicle benchmarking where control strategy or powertrain performance are largely unknown.
Traditional power measurement systems also lack a method of correlation and feedback to external systems. This is necessary to correlate their power signals to the environmental data often collected by existing data acquisition systems.
GPS, video, temperature and the vehicle status give an engineer significantly more insight into what was happening during the test. Hard braking, swerving to miss an obstacle or harsh traffic conditions may affect a vehicle output or demonstrate a bug in the vehicle control. Without GPS or video, engineers rely on the driver’s memory to recall these events. A proper test run would need to incorporate external test conditions to achieve full transparency of the test results.
Traditional mobile DAQ systems were not intended for high-frequency and high-voltage signals generated by inverters. Mobile DAQ systems have sample rates that max out at around 100 kS/s, which is more than enough for structural or frequency data but does not provide sufficient bandwidth to obtain good power accuracy from a PWM inverter. These inverters, which turn on and off at high voltages and at frequencies greater than 20 kHz, require a much higher sample rate to accurately measure RMS voltages and currents.
Traditional mobile DAQ systems are also unsuitable for higher voltages, which is an issue with DC bus voltages upwards of 900 V. These measurements can be made with voltage probes, but there will be a decrease in accuracy.
It is possible to use in-vehicle sensors to measure power values, but they are usually low-cost and low-accuracy sensors that update at a slow rate to the CAN bus. Typically, this is not useful when collecting dynamic power data because the method lacks accuracy and does not provide any insight beyond the slow data rate. However, this is being addressed with a new generation of in-motor sensors (see below).
Continuous sampling
One way to address these challenges is to constantly record the PWM voltages and currents at up to 2 MS/s per channel with real-time calculations on a digital signal processor (DSP) built into the hardware. The DSP executes equations in real time including a unique cycle detect algorithm. The cycle detect algorithm digitally filters the phase A current, finds zero crossings, takes the time between two successive zero crossings and uses that time for RMS calculations. The DSP then calculates the RMS voltage, current, power and efficiency on the half-cycle basis.
The real-time calculation of these values cuts down on post-processing time and gives the user instant feedback on the state of the system.
The combination of recorded high-sample-rate data and availability of equations provides traceability of power results, rather than a black box outcome. In addition, the equations are processed in real time, meaning that they can be transferred onto a CAN bus for correlation to outside systems
Signal correlation
Powertrain testing on the road is significantly different from testing in a lab because there is a high level of unpredictability in the test conditions. For example, to measure torque and speed in a lab, a torque and speed setting are input to a dynamometer and a measurement is made. To do the same test in a vehicle, it must be set to a fixed speed, but this will vary with wind, road conditions and elevation. Measuring a fixed torque in a vehicle requires the proper loading, which could mean finding a hill that is steep enough to hit the desired power point or going as far as hooking a trailer to the vehicle or loading the vehicle down with weights.
In-vehicle testing is also used to find issues with performance or control. If the powertrain does not perform as expected under certain conditions, engineers will want to understand the causes of the failure and replicate them.
To be able to properly understand these environmental issues, it is necessary to correlate measurements such as video, GPS, acceleration, CAN bus and others to the power values. These types of measurements will provide insight into pedal position, wheel angle and environmental conditions that affect the total vehicle performance.
Fortunately, these measurements are often already made by vehicle engineers with existing DAQ systems. A system that measures dynamic power can start to introduce real-time power to the available channels measured for those engineers. The combination of dynamic power measurements with environmental data will provide a significant amount of data to improve vehicle performance.
To achieve this, the cycle-based calculations are sent over the CAN bus for correlation to an existing DAQ system. The high-frequency data are stored locally, but information on the power, control and other variables is also transferred to CAN for correlation.
This test set-up provides power data to groups performing structural, NVH and fatigue testing, but also provides high-frequency data with context to powertrain and control engineers. All the high-speed or cycle-based signals can be viewed live on a computer in the cabin providing the user with visual feedback on the state of the powertrain.
Regenerative braking
How and when a vehicle enters regenerative braking is of interest to powertrain engineers, but how the driver interacts with the regeneration also needs to be considered. The current and power slowly ramp down as vehicle speed starts to decrease. The current then goes to almost zero but increases shortly after, despite the continued decrease in speed. At this point, the power goes negative, which indicates that there is power being put back into the battery.
The vehicle continues to slow down and eventually the power goes positive. This indicates that there is no longer enough power being put back into the battery and this energy is now contributing to losses. This shows how regeneration can introduce additional losses. When designing a system that is operated by real users, this can be valuable information for choosing when to turn regeneration on or off. Regeneration can also affect user experience and data can help correlate things like hard or bumpy stops to unwanted effects on the powertrain.
Examples of dynamic control
In addition to power calculations, a test system can perform control transform calculations in real time. The ability to do space vector or DQ0 transforms will supply users with information to help determine whether the machine is behaving as expected. By recording the measured control variables with the CAN data output by the vehicle, control engineers can see if the machine is implementing what its controller thinks it is doing. Monitoring the control technique also allows users to understand unexpected disturbances.
How the vehicle controller handles the transient will be of interest to engineers in electric powertrain groups. If there is too much current in the wrong axis, there could potentially be demagnetisation of the rotor. There may also be limits on how much current a system can handle.
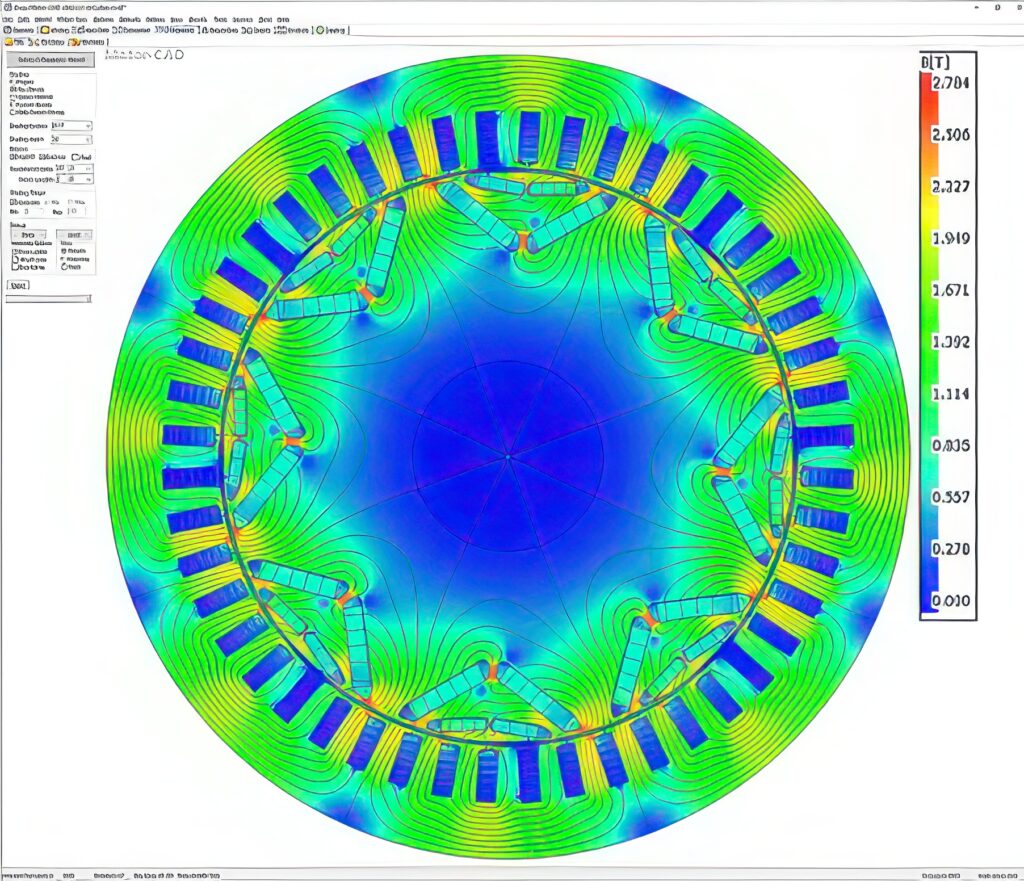
Simulation
While physical testing is critical to gaining insight about motor performance, it has its limitations. Simulation enables technicians to expand testing by seeing inside the machine to reveal exactly what is happening (both now and in the future), as well as showing the health of the deepest inner workings of a motor.
With simulation, engineers can explore various design options against different operating scenarios and make adjustments before production, during production and even while the motor is being used. Especially in scenarios in which physical testing is restricted by lack of visibility (owing to size or location of the test), simulation can quickly perform the calculations required to make an accurate assessment.
The use of simulation in electric motor testing not only improves the speed and efficiency of the testing process itself, but also improves the quality, depth and reliability or certainty of the data collected. Simulation software can perform coupled multiphysics calculations, providing engineers with thorough assessments of complex systems — assessments that would be impossible to achieve one test at a time.
Using simulation to run physical tests in a virtual environment, engineering teams can save time and costs. Simulation also reduces the number of design iterations and identifies problems before any hardware is built. This leads to a better, more robust design and ensures no surprises when it comes to the physical testing.
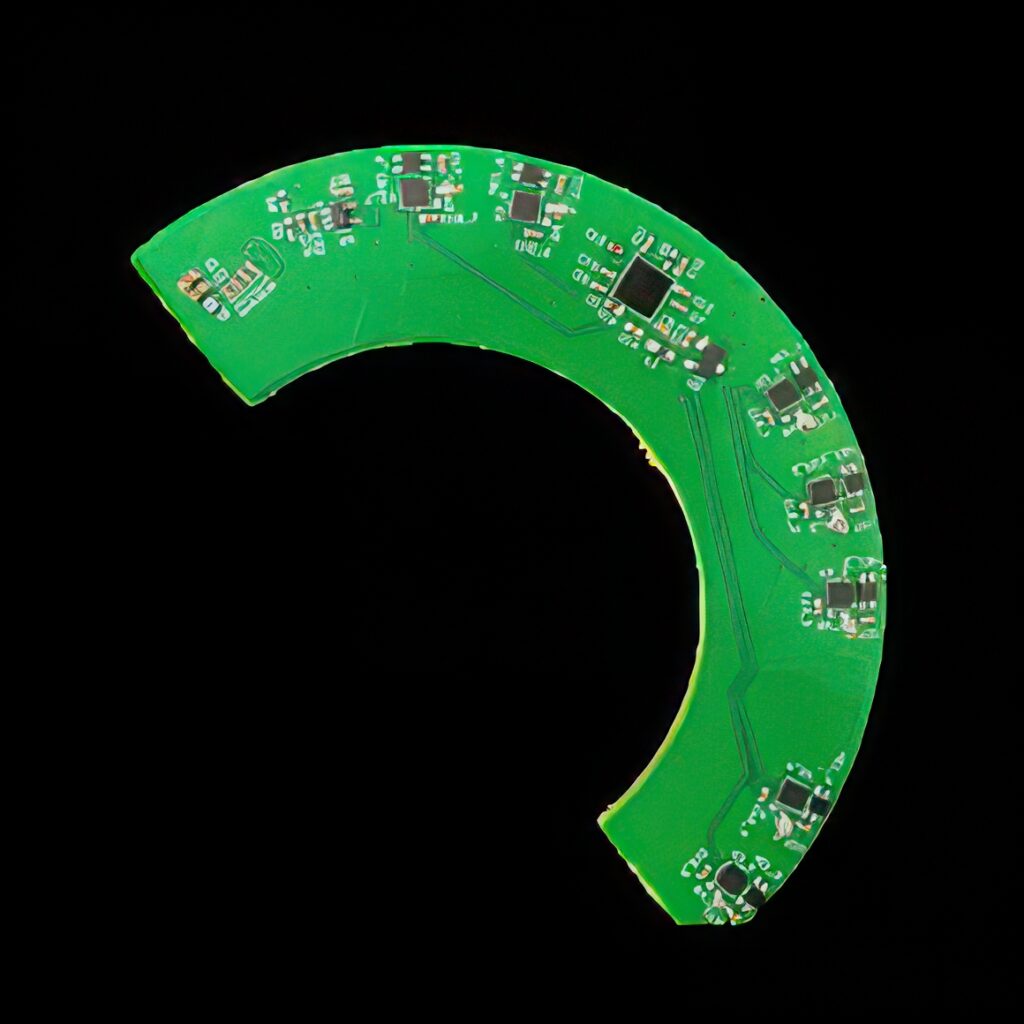
In-motor sensing
The latest in-motor sensor system uses an inductive position sensor rather than a resolver to measure the position of the rotor in the electric motor. A key advantage is that this can be integrated with a current sensor with vector control to reduce the cost and improve the performance.
One way of doing that is measuring the fields inside the motor but the stator and motor magnetic fields overlap, creating a challenge for the measurement system. A new real-time algorithm is able to measure the field. This is implemented in a sigma delta architecture for low latency, which is critical for the powertrain control loops. The interesting part is that the sensing technology can work with existing sensors such as tunnel magnetoresistance (TMR) or Hall Effect sensors.
TMR sensors typically consist of two ferromagnetic layers separated by a non-magnetic spacer layer. When a magnetic field is applied, the relative alignment of the magnetic moments in these layers affects the electron tunnelling probability, leading to a measurable change in resistance. This change in resistance forms the basis for sensing various parameters such as magnetic field strength, position and direction.
The sensors, placed in an array of seven in the motor on a PCB for the position and the currents, provide two degrees of freedom for the position and three for the current. The other two sensors are used for functional safety, which is enabled in the algorithm and improves the accuracy of the measurement. The functional safety does not require full redundancy of the sensor array because any degradation can be detected by performing a correlation check between the sensors.
The distance to the coils is critical and the choice of sensor depends on the magnetic field. If the array is closer to the air gap, Hall Effect sensors can be used; if further away, then the more sensitive TMR sensors are more appropriate. The added value of TMR is being able to place the array further away from the coils, which reduces the impact of the changing fields created by the changing voltage (the dv/dt). With motors running at 800 V and above, this is critical.
Advances in TMR improve the options for the mounting position to reduce the dv/dt. For example, the module, typically 4 mm thick, can be C-shaped to ease the mounting around the shaft with span of 120° to cover at least one pole pair and ideally two pairs.
This allows the system to infer, in real time, the magnetic field of the stator and the rotor with a low-cost microcontroller to determine the position of the rotor.
The advantage of this approach is that the PCB in the motor, unlike other inductive posi tion sensors, does not need a target to make the magnetic measurement. Removing the target shrinks the axial length of the motor.
There is also a cost improvement of around 50% for the bill of materials over using separate current sensors and resolver motor position sensors.
Measuring the magnetic field data of the air gap detects deviations for the calibration data to trigger functional safety errors. Providing a quantitative error also means other functions can be implemented, particularly predictive maintenance, to predict failures in the motor from the error size and pattern.
The technology can go up to 40,000 rpm and is limited only by the 10 kHz angular update rate for the sampling, which is determined by the analogue-to-digital converter in the microcontroller. The maximum error is 0.2° at 4000 rpm in a 200 A demonstration system, and this is a pattern error that might be correctible in the future but already meets system requirements.
The technology then needs to be integrated into a system to assess the system requirements. From a cost perspective, one of the biggest challenges is the oil cooling in the motor because a splash of hot oil could damage the PCB. Therefore, either an enclosure or a conformal coating is used, depending on the space available.
Summary
There are many different ways of testing an EV electric motor for dynamic performance. Simulators with multiphysics engines can provide high-performance data acquisition systems, and the latest power analysers can then provide accurate data in the lab and be used for mobile testing. The new generation of in-motor test systems is improving the accuracy of the data with existing sensors, and enabling functional safety and predictive maintenance along with real-time motor data, while providing more integration and reducing the bill of materials cost.
Acknowledgements
With thanks to Javier Bilao de Mendizabal at CTS, Mircea Popescu at Ansys/Synopsys, Alexander Stock at Hottinger Brüel & Kjær (HBK) and Michael Rietvelt at Yokogawa Test and Measurement.
Allegro Microsystems
CTS
Dewesoft
Emerson Electric/NI
Gantner Instruments
Hottinger Brüel & Kjær
Pickering Interfaces
Synopsys/Ansys
Yokogawa Test & Measurement
Click here to read the latest issue of E-Mobility Engineering.
ONLINE PARTNERS
