


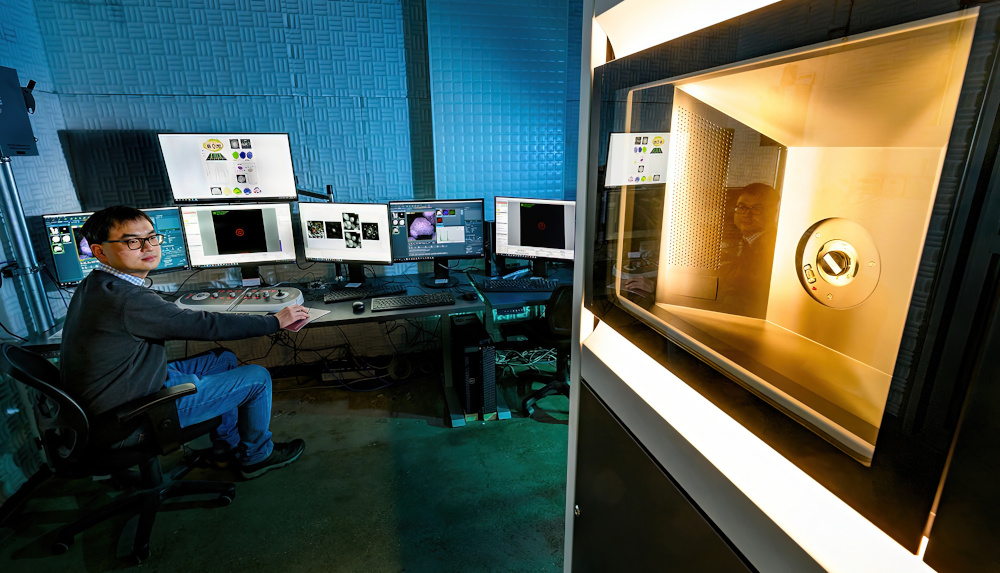
Battery testing
(Courtesy of Argonne National Laboratory)
The inside story
Nick Flaherty explains the various non-invasive methods of analysing the workings of battery cells and their materials
Testing battery cells, modules and packs presents a series of challenges. First of these is that taking measurements of the current and voltage changes the state of charge (SoC) of the cell and has an impact on its state of health.
Also, because the battery is sealed, when it goes wrong it can be hard to see what faults occur. Taking the battery apart introduces internal changes that make it hard to see what the original flaw was or where it occurred. Non-invasive techniques, from X-rays to electron microscopes and even MRI scanners are therefore being used to examine how all kinds of cells operate without having to pull them apart.
The data obtained using these technologies allows researchers to look at the materials being used, and even to see inside the cell while it’s in operation. The data is vital for building more detailed, accurate models of how the cell operates over time to gauge the reliability and lifetime of the cells and packs. It is also extremely helpful for the emerging machine learning (ML) frameworks that are also being used to improve the accuracy of models.
X ray analysis
X-ray analysis has helped to identify how materials work in a cell. One new cell compound, niobium pentoxide, has a novel crystalline structure and shows promise for speeding up charging while providing excellent storage capacity.
During charging, lithium ions move from the cathode to the anode, which is commonly made of graphite. At higher charging speeds, lithium metal tends to accumulate on the graphite’s surface. This effect, known as plating, tends to degrade performance and can cause batteries to short-circuit, overheat and catch on fire.
Niobium pentoxide is much less susceptible to plating, potentially making it safer and more durable than graphite. In addition, its atoms can arrange themselves in many different stable configurations that don’t require much energy to reconfigure them.
A coin cell with niobium pentoxide as the electrode material has been built and tested using a range of X-ray technologies. The compound started out with an amorphous structure but as the cell was charged and discharged numerous times, the structure transformed into an ordered, crystalline one, which had never been seen previously.
(Courtesy of Dennis Schroeder, NREL)
Compared with the disordered arrangement, the crystalline structure enabled easier and faster transport of lithium ions into the anode during charging. This points to the material’s promise for fast charging, and other measurements suggest it can store a large amount of charge.
Because of the complex changes during the charge-discharge cycle, several complementary measurement tools were needed to gain a comprehensive understanding of the nanostructure.
For example, transmission electron microscopy was used to verify the structural transformation from amorphous to crystalline, with high-energy electron beams creating digital images based on the interaction of the electrons with the sample. As the electron beam is focused on a small part of the sample, the technique provides detailed information about that particular area.
A device known as the Advanced Photon Source confirmed the structural change with another technique called synchrotron X-ray diffraction. The non-invasive test procedure involves hitting the sample with high-energy X-ray beams, which are scattered by the electrons of the atoms in the material. A detector measures this scattering to characterise the material’s structure.
X-ray diffraction is effective for providing information about overall structural changes across an entire material sample. That can be helpful when studying battery electrode materials, because their structures tend to vary from one area to another. Hitting the anode of a cell with X-ray beams at different angles confirms that it was uniformly crystalline along the surface and in the interior.
X-ray photoelectron spectroscopy is another way to evaluate the anode material. Here, X-ray beams are shot into an anode, ejecting electrons from it with a certain energy. This showed that the niobium atoms gain multiple electrons as the cell is charged, suggesting that the anode has a high storage capacity.
Yet another technique, X-ray absorption spectroscopy, is used to hit the anode material with intense synchrotron X-ray beams and measure the transmission and absorption of the X-rays in the material. This provided an overall picture of the state of the electrons across the entire anode.
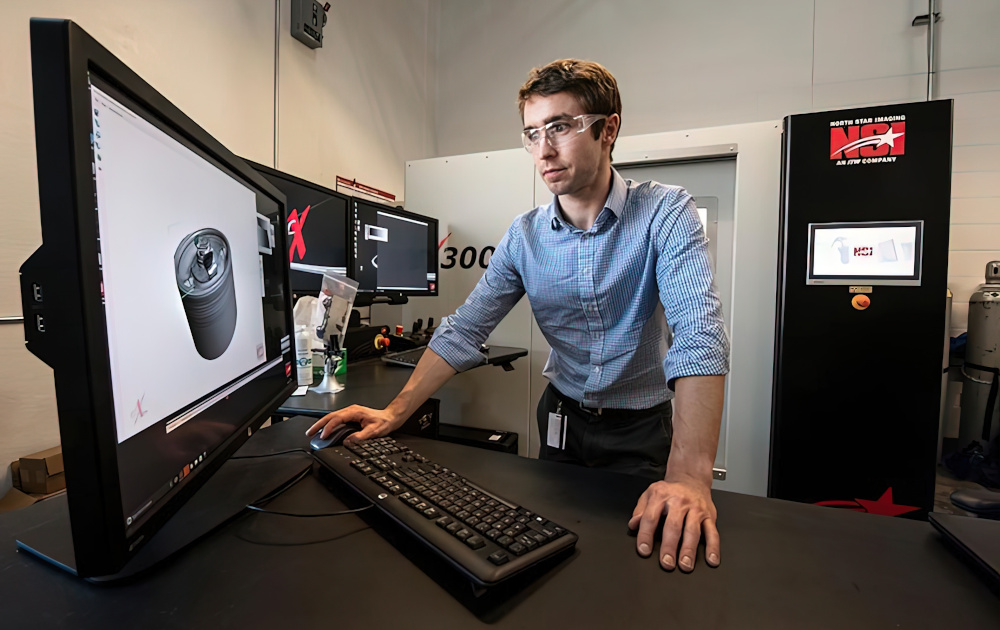
There are also several key X-ray technologies for identifying contaminants in battery materials. 75% of the cost of a battery cell is in the materials, so identifying contaminants early in the process can help reduce the scrap rate and lower the cost of a cell. It can also help with recycling.
X-ray transmission takes an image as a line through a material to detect the embedded contaminants, which can be as small as 20 microns. A scan using a 17.5 kV X-ray source at 35 mA of a 250 x 200 mm sample of material can take 7 to 10 minutes.
X-ray fluorescence operates at 45 kV up to 1 mA is then used to identify any contaminants in a material. A 20 micron contaminant can take 60 to 90 seconds to analyse, and the overall scanning time depends on the number of contaminant particles in the sample.
The key is the X-ray optics that focus the full energy of the beam into the contaminant particle. The system, called polycapillary optics, uses an array of small hollow curved and tapered glass tubes through which the X-rays are guided by multiple internal reflections. The system includes a silicon drift detector to pick up the fluorescence from the contaminating particle’s X-rays to determine what it is made of.
The process can be automated to examine contaminants above only a specified size, as well as specifying the number of particles to be examined, which speed up the process. The data from the contaminants can also be stored for analysis by ML algorithms to further speed up the testing process. These automated processes – or ‘recipes’ – can be set for different materials, optimising the testing speed depending on the type of material such carbon black, separator, anode and cathode electrodes and the risk of contaminants being present.

X-ray for cells in operation
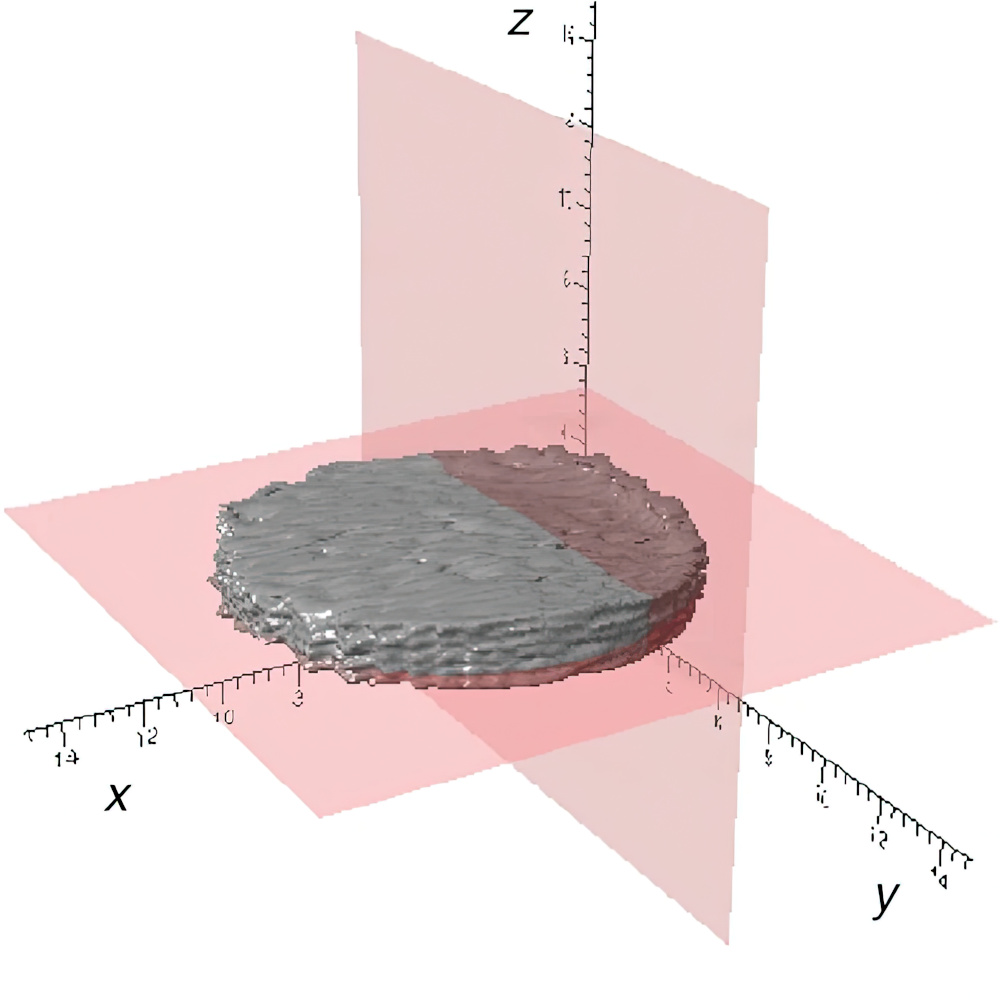
X-ray diagnostics are also used to assess the operation of a battery cell rather than the materials before they are assembled.
X-rays can probe changes as they occur in real time without significantly interfering with the cell. This requires special in-situ environments for imaging during the mechanical, electrochemical or thermal changes within the material of interest.
X-ray computed tomography has been used to build a comprehensive electrode microstructure library where researchers can compare battery electrode samples that have or have not artificially generated conductive carbon in the binder material. Researchers can use this databank to access realistic architectures for modelling or analysis.
High-energy X-rays from large synchrotrons are used to quantify gradients in lithiation and degradation throughout the depth of electrodes during fast charging and within individual electrode particles while they degrade. This can be used to understand the failure mechanisms of lithium-ion batteries in a range of mechanical and thermal abuse scenarios.
This has led to an open-source battery failure databank containing hundreds of high-speed radiography videos of catastrophic battery failure alongside their thermal responses. The databank gives researchers and engineers an insight into designing safer battery systems.
MRI for sodium cells
Magnetic resonance imaging (MRI) can be effective in developing rechargeable sodium-ion batteries.
A key challenge in the development of these batteries is understanding how the sodium behaves inside the battery as it goes through its charge-discharge cycle, enabling the points of failure and degradation mechanisms to be identified.
In medical imaging, MRI scanning uses the body’s natural sodium content to provide a more detailed picture of tissue health and disease. The same technique is used to monitor how the sodium performs in different anode and cathode materials. It can also monitor the growth of dendrites that grow inside the battery over time and cause it to fail or even catch fire.
MRI gives information about the changes in a sodium-ion battery’s components during its operation, something that is currently not available using other techniques. It will enable the identification of methods for detecting failure mechanisms as they happen, giving insights into how to manufacture longer-life and higher performing batteries.
(Courtesy of University of Nottingham)
A major challenge for the characterisation of sodium batteries is that certain states of sodium within the electrodes are metastable, and the materials in the cell can be highly sensitive to changes in environmental conditions when a battery is dismantled for analysis.
Another technique, nuclear magnetic resonance spectroscopy (NMR), which is similar to MRI, has previously been used to quantify the deposition of microstructural sodium on metallic anodes and determine the chemical environment in hard-carbon anodes. This provides peaks of data that are attributed to the sodium adsorbed at defect sites in the carbon, which subsequently pools between graphene layers.
However, NMR is extremely sensitive to trace air/moisture, and the peak associated with sodium in the carbon has been found to disappear over a few hours. So while MRI has lower spatial resolution than X-ray or electron microscopes, it can probe both electrode and electrolyte environments, providing a more holistic view than NMR with visualisation of the 3D microstructure of the metallic electrodes in the cell.
Lithium metal cell analysis
Lithium metal is an ideal anode material thanks to its extremely high theoretical specific capacity (3860 mAh/g), low density (0.59 g/cm3 ) and the lowest negative electrochemical potential (-3.05 V versus standard hydrogen electrode).
However, the use of lithium-metal batteries (LMBs) is still limited owing to dendrite growth in the cell during cycling. This growth is responsible for early cell failure and even short-circuits and fires.
But specific detection techniques can be applied to verify the internal condition of new LMB chemistries through cycling tests and examine the dendrite growth.
Six non-invasive techniques have been investigated to anticipate LMB failures and to lay the basis for innovative self-healing mechanisms. The methodology governing these techniques is based on parameters that track the evolution of cell ageing and a detection algorithm, validating the algorithm in its capability to detect failure.
Dendrites form from inhomogeneities of the solid electrolyte interphase (SEI) that represents a highly conductive pathway for lithium ions. The concentrated ions are reduced, causing fractures in the SEI layer owing to volumetric expansion. The fractures represent suitable sites for deposition of lithium metal that forms dendrites.
During an LMB’s cell’s early cycles, dendritic deposition is ‘mossy’ and then progresses in a fractal configuration when the lithium ion concentration reaches zero value at the interface between the anode and the electrolyte. High current density leads to a fast-growing fractal dendrite structure that can penetrate the separator and may cause hazardous internal short-circuits.
The LMB cells used for the evaluation consist of lithium nickel manganese cobalt oxide as the active cathode, coated on top of a 15 µm-thick aluminium current collector, and a copper foil double-coated with lithium metal mixed with a small amount of aluminium as an anode material (99.7% lithium and 0.3% aluminium) and a monolayer polypropylene separator of 20-40 µm thickness.
In the investigation a total of five cathode foils and six anode foils alternated with 12 separator layers were stacked into a pouch cell. This stack was prepared in a controlled environment and filled with the electrolyte before sealing in a four-layer pouch foil of PET, oriented nylon, aluminium and polypropylene housing. The cells were produced in three batches at different times, with an average weight of 11 g, a theoretical capacity of 670 mAh and an estimated gravimetric energy density of 225 Wh/kg.
The structured methodology tested and validated the parameters that can be used to detect degradation in LMBs, and which should be non-invasive and can trigger self-healing mechanisms by a battery management system.
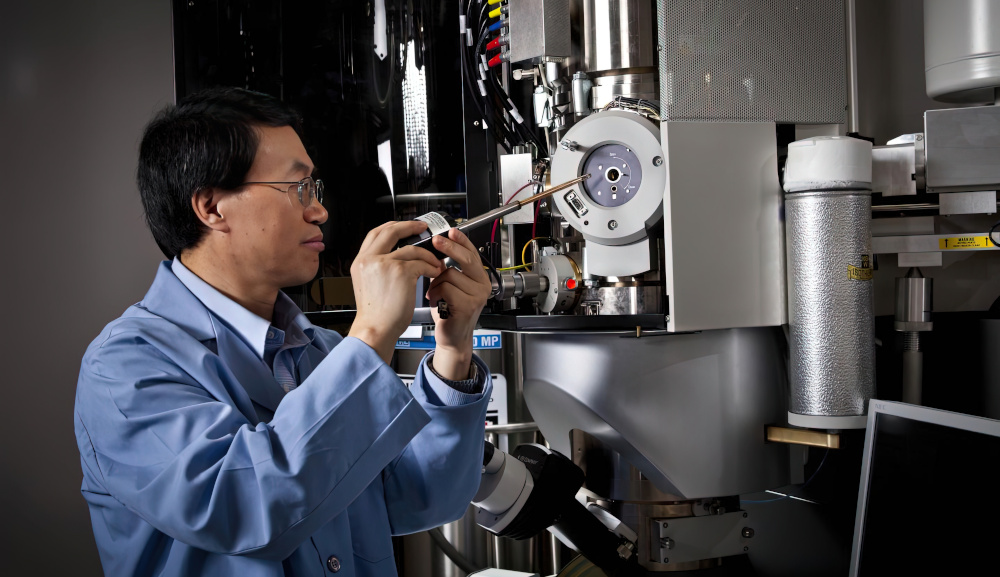
Electron microscopes
An electron microscope can also be used to monitor the workings of a battery cell. To that end, Researchers have built a lithium-air nanobattery inside the measurement column of a transmission electron microscope that allowed them to watch the battery charging and discharging.
This showed a grey bubble developing on the battery’s flat surface that grew bigger. Later, the bubble deflated, the top turning in on itself until only a crumpled shell was left behind.
(Courtesy of PNNL)
Fully understanding the bubble formation process could allow better lithium-air batteries that create fewer bubbles. This would lead to more compact and stable batteries that hold on to their charge for longer.
The video data from the bubble-forming process led the team to propose that as the battery discharges, a sphere of lithium superoxide jets out from the battery’s electrode and becomes coated with lithium oxide. The sphere’s interior then goes through a chemical reaction that forms lithium peroxide and oxygen. Oxygen gas is also released and inflates the bubble. When the battery charges, the lithium peroxide decomposes, and leaves the former bubble to look like a deflated balloon.
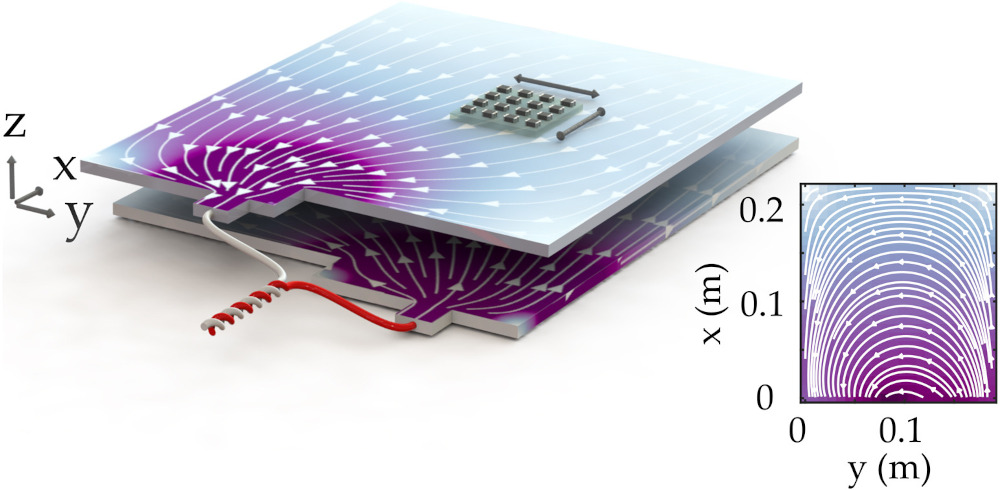
Magnetic sensing
Another non-invasive testing approach is to use arrays of sensors to map the magnetic field above EV pouch cell. The current density distribution reconstructed from this map, using finite element analysis simulations, confirm the results to within a percentage point.
Current density is critical in causing SoC inhomogeneities, predicting heat generation, SEI formation, inhomogeneous extraction of lithium ions and lithium plating.
A deeper understanding of these effects will help to maximise battery lifetime. The ability to spatially resolve regions of high electrical conductivities will allow the monitoring of defect formation, such as dendrite growth, in real time. It will also help with the investigation of conduction phenomena and characterisation of new battery chemistries with more accuracy than open-circuit voltage measurements.
One particular area of interest is inhomogeneous current density distribution within a material. This distribution is important in understanding lithium-ion transport mechanisms, including long-term ageing. Direct measurements of current density also complement the modelling and simulation of battery behaviour during constant-current discharge processes.

While thermal imaging can provide some of this data, the measurements of magnetic fields are instantaneous.
The highly sensitive magnetometers used to measure the fields perform a non-invasive, in-operation and contact-free measurement of local current densities inside the cell through the magnetic fields that exist outside the cell.
The technique is suitable for lithium-ion pouch cells and other types of batteries and cell formats with the appropriate adjustment of the computational current reconstruction protocols.
To demonstrate the technique, a pouch battery, with a rated capacity of 66 Ah, was dismantled to extract a single cell. Each cell is composed of 35 electrode pairs, in addition to aluminium and copper current collectors, the dimensions of which are 22 x 26 cm.
The battery was placed 6 mm below a 4 x 4 array of low-cost single-axis magnetometers. Each magnetometer in this fluxgate array (FGA) was configured to record a component of the magnetic flux density in a plane above the cell.
To shield the sensor array from external magnetic noise, it was placed inside two layers of 1 mm-thick, high-permeability mu-metal that channels magnetic flux through its walls and acts to reduce the ambient magnetic flux density in the volume occupied by the FGA and battery. A motorised three-axis track moved the cell in a 2D plane beneath the array with a positioning reproducibility accuracy of around 10 µm
The magnetic field was recorded in three states. First, a battery cycler, acting as a constant current source/sink, was used to charge or discharge the cell. A background magnetic field of 10 µT was then recorded with the cell disconnected from the battery cycler and positioned away from the FGA. This measurement was used to track the offset drift of the FGA, which varies with temperature.
Third, the passive field, believed to be due to nickel plating on the copper current collector, was measured. This was stable to charging and discharging to a value of 100 nT in the 10 µT field.
(Courtesy of Mark Bason, University of Sussex)
The choice of charging rate is a trade-off between capturing a narrow SoC ‘window’ versus the time taken to translate the FGA array over a region of interest, so each measurement took 12 minutes to scan an area of around 150 cm2 with a resolution of 5 mm.
The results were tested against simulations using finite element model. The tests showed magnetic fields of over 100 µT, agreeing with the finite element simulations.
The strength of the magnetic field was found to be dominated by the high current density at the input and output of the current tabs on the cell. The current is concentrated at the input and dies off away from these tabs. As the exact current density distribution is characteristic of the cell’s effective conductivity and cell geometry, any changes in the magnetic field distribution can be used to infer cell properties, such as the amount of lithium in an electrode, called the lithiation state, and how fast the lithium ions move through the cell,
To investigate effects not captured by the model, such as changes in the SoC, the non-invasive test system can also measure magnetic fields changes that emerge at different charge stages.
Starting with a battery with an open cell potential of around 3.7 V, the cell is cycled between charge states with a constant current of 10 A in stages of 1.3 Ah. This provides magnetic field changes between the cycles, corresponding to the SoC. This data can be used to refine simulation models.
Larger magnetometer arrays will allow the simultaneous capture of data from across the battery and remove the need to move the FGA array across the material. This will allow the capture of current density images at higher rates of charge/discharge – situations in which equivalent circuit models often struggle to describe battery behaviour.
Arrays with smaller sensor spacing, such as magnetometers based on nitrogen vacancy centres in diamond, could capture higher resolution images, potentially with a resolution of tens of nanometres.
AI
Machine learning (ML) has been used to predict battery health with 10 times higher accuracy than the current industry standard, which could aid in the development of safer and more reliable batteries for EVs.
The technique sends electrical pulses into the cell and measures the response. The measurements are then processed by an ML algorithm to predict the battery’s health and useful lifespan. The key factor is that the method is non-invasive and is a simple add-on to any existing battery system.
Predicting the state of health and the remaining useful lifespan of lithium-ion batteries is one of the major limits on the widespread adoption of EVs. Over time, battery performance is degraded owing to a range of chemical processes. Individually, each process doesn’t have much effect on battery performance, but collectively they can severely shorten a battery’s performance and lifespan.
Current methods for predicting battery health are based on tracking the current and voltage during battery charging and discharging, but that misses important indicators of battery health. Tracking the many processes taking place in a battery requires new ways of probing batteries in action, as well as new algorithms that can detect subtle signals as they are charged and discharged.
Improving the software that monitors charging and discharging, and using data-driven software to control the charging process, provides a major improvement in battery performance.
(Courtesy of Proventia Test Solutions)
The technique combines electrochemical impedance spectroscopy (EIS) with Gaussian process machine learning.
EIS is a real-time, non-invasive and information-rich measurement that has not previously been used for batteries. More than 20,000 EIS spectra of commercial LCO/graphite lithium-ion batteries were collected at different states of health, states of charge and temperatures.
The Gaussian process model takes the entire spectrum as its input, without further modification, and automatically determines which spectral features predict degradation. The model then accurately predicts the remaining useful life, even without complete knowledge of past operating conditions of the battery.
Importantly, the model learns how to distinguish important signals from irrelevant noise.
This approach can also give hints about the physical mechanism of degradation. It can estimate the capacity and health of batteries cycled at three constant temperatures, at any point in its life, from a single impedance measurement.
The model can also indicate which electrical signals are most correlated with ageing, which in turn allows specific experiments to probe why and how batteries with particular chemistries degrade.

Modelling
Another way around the challenges of testing cells is to use modelling, which is becoming increasingly important as the size and complexity of e-mobility platforms increases. It is a particular issue for applications such as off-road and construction equipment, which have a wide variety of designs.
One battery integrator uses 20 Ah LTO cells for high power output with extensive simulation based on testing the cells. Powertrains are so complex that it is not viable to use a trial-and-error approach, so before building prototypes good simulation models of the powertrains and the battery systems are essential. These are electrochemical, thermal and electrodynamic models for a standard base LTO 1 kW, 46 V module that can be used to build 400 or 800 V battery systems for hundreds of kilowatts.
The models are built by the integrator, taking cell-level measurements to turn cell-level simulation models into a module model; the system model is then a repetition of the module models. This has to be supported with real-world testing to validate the models, including thermal testing, in-house.
Conclusion
Many different techniques can be used for non-invasive analysis of materials and cells in battery packs. X-rays are increasingly popular, providing data for modelling and ML frameworks. This increased accuracy of data is helping provide more information about the reliability and lifetime of all kinds of cell chemistries for all sorts of e-mobility applications.
Acknowledgements
The author would like to thank Johannes Eschenauer at Hitachi High-Tech Analytical Science and Jari Granath at Proventia for their help with researching this article.
4D-STEM for non-invasive testing
Adding a dimension to the various cell measurements is helping scanning transmission electron microscopy (4D-STEM), coupled with electron energy loss spectroscopy (EELS) and data mining to explore the structure of cubic spinel manganese dioxide nanoparticles in a cathode.
The 4D aspect of STEM uses an electron detector to capture a convergent beam electron diffraction (CBED) pattern at each scan location. This captures a 2D image at each scan point as the beam moves across the two dimensions of the sample. This has been enabled by developments in the electron detectors and improvements in processing.
This technique is more often used for examining ceramic materials, but when used for electrode materials it gives a tenfold increase in the resolution of the structure of nanoparticles over X-ray systems.
During the operation of rechargeable ion batteries, ions diffuse in and out of the electrodes, causing mechanical strain and sometimes cracking failures. The 4D-STEM technique captures the strain-caused nanoscale domains inside battery materials for the first time. This is critical for mapping otherwise inaccessible variations of crystallinity and domain orientations inside the materials.
(Courtesy of University of Illinois)
Adding complex data analysis, or data mining, to identify structures in the materials show a pattern of nucleation, growth and coalescence inside the batteries as the strained nanoscale domains develop.
This non-invasive test approach also shows that the electrolytes have a substantial impact on the transformation of the microstructure. Large strain gradients build up from the development of phase domains across their boundaries with high impact on the chemical diffusion coefficient by a factor of ten or more.
IN 4D-STEM the data is collected in the same way as standard transmission electron microscopy, but with different detectors for faster measurements. Rather than phosphorescent scintillators paired with a charge-coupled device, 4D-STEM uses a pixelated electron detector located at the back focal plane that collects the CBED pattern at each scan location.
This sensor can be a monolithic active pixel sensor, which is a CMOS pixel array with a doped epitaxial surface layer that converts high-energy electrons into many lower energy ones that travel down to the detector. This gives a pixel resolution of up to 4000 x 4000, and enables the detection of individual electronics.
An alternative sensor is a pixel array detector. This consists of a photodiode bump bonded to an integrated circuit, where each solder bump represents a single pixel on the detector.
This type of detector has a smaller number of pixels, typically 128 x 128, but can achieve a much higher dynamic range of the order of 32 bits and high-speed detection of 1 ms per pixel.
Using a hollow detector with a hole in the middle allows transmitted electrons to be passed to an EELS detector while scanning. This allows for the simultaneous collection of chemical spectra information and structure information.
The computation aspect is also important. The detectors generate vast amounts of data, as much as 100 Tbytes per scan. ML algorithms can dig through the data to identify patterns that give more insight into the structures inside a battery.

Some suppliers of battery testing systems
Complete systems
Alvatek
Arbin Instruments
AVL
Chroma ATE
ITech ATE Keysight Technologies
Maccor
Megger
National Instruments
Neware Battery
PEC
Proventia Test Solutions
X-ray systems
3DX-ray
Excillum
Hamamatsu Photonics
Hitachi High Tech
Kratos AnalyticsGroup
MTIxtl
Nordson
North Star Imaging
Uni ray
Complete systems
+1-302-425-9595
+1 979 690 2751
+1 800 352 4343
+1 949 421 0355
— +1 800 829 4444
+1 918 446 1874
+44 1304 502100
+44 1635 523 545
+86 189 2840 4004
+32 16 39 83 39
+358 20 7810 200
X-ray systems
+44 1509 817 400
+46 8 750 96 60
+44 1707 294 888
+81 3 3504 7951
+44 1618 884 400
+1 510 525 3070
+1 877 667 3782
+763 312 8836
+91 70453 01109
Complete systems
www.alvatek.co.uk
www.arbin.com
www.avl.com
www.chromaate.com www.itech.sh
www.keysight.com
www.maccor.com
www.uk.megger.com
www.ni.com
www.en.neware.com.cn
www.peccorp.com
www.proventia.com
X-ray systems
www.3dx-ray.com
www.excillum.com
www.hamamatsu.com
www.hitachi-hightech.com
www.kratos.com
www.mtixtl.com
www.nordson.com
www.4nsi.com
www.uniraymedical.com

ONLINE PARTNERS

